Simple histogram plot
Matplotlib’s example for histogram plots.
[1]:
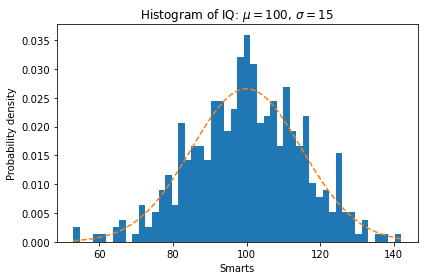
import numpy as np
import matplotlib.pyplot as plt

np.random.seed(19680801)

# example data
mu = 100  # mean of distribution
sigma = 15  # standard deviation of distribution
x = mu + sigma * np.random.randn(437)

num_bins = 50

fig, ax = plt.subplots()

# the histogram of the data
n, bins, patches = ax.hist(x, num_bins, density=True)

# add a 'best fit' line
y = (1 / (np.sqrt(2 * np.pi) * sigma)) * np.exp(-0.5 * (1 / sigma * (bins - mu)) ** 2)
ax.plot(bins, y, "--")
ax.set_xlabel("Smarts")
ax.set_ylabel("Probability density")
ax.set_title(r"Histogram of IQ: $\mu=100$, $\sigma=15$")

# Tweak spacing to prevent clipping of ylabel
fig.tight_layout()
plt.show()
[ ]: